EXPLAINER
PRaG therapy.Read the evidence.
PD-1 inhibition, radiotherapy and GM-CSF. A closer look at the original phase II study, its findings and the questions still open.
Read the analysis
Research in radiotherapy and immunotherapyPublications, clinical trials and analysis
EXPLAINER
PD-1 inhibition, radiotherapy and GM-CSF. A closer look at the original phase II study, its findings and the questions still open.
Read the analysisClinical study
The Fudan-led multicenter SWORD trial reports efficacy and final safety beyond its initial 20-patient safety run-in.
Observational analysis
This retrospective series examines feasibility in older adults, a group often underrepresented in trials.
Clinical study
The foundational phase II report investigated whether the PRaG triplet could produce responses in previously treated metastatic cancer.
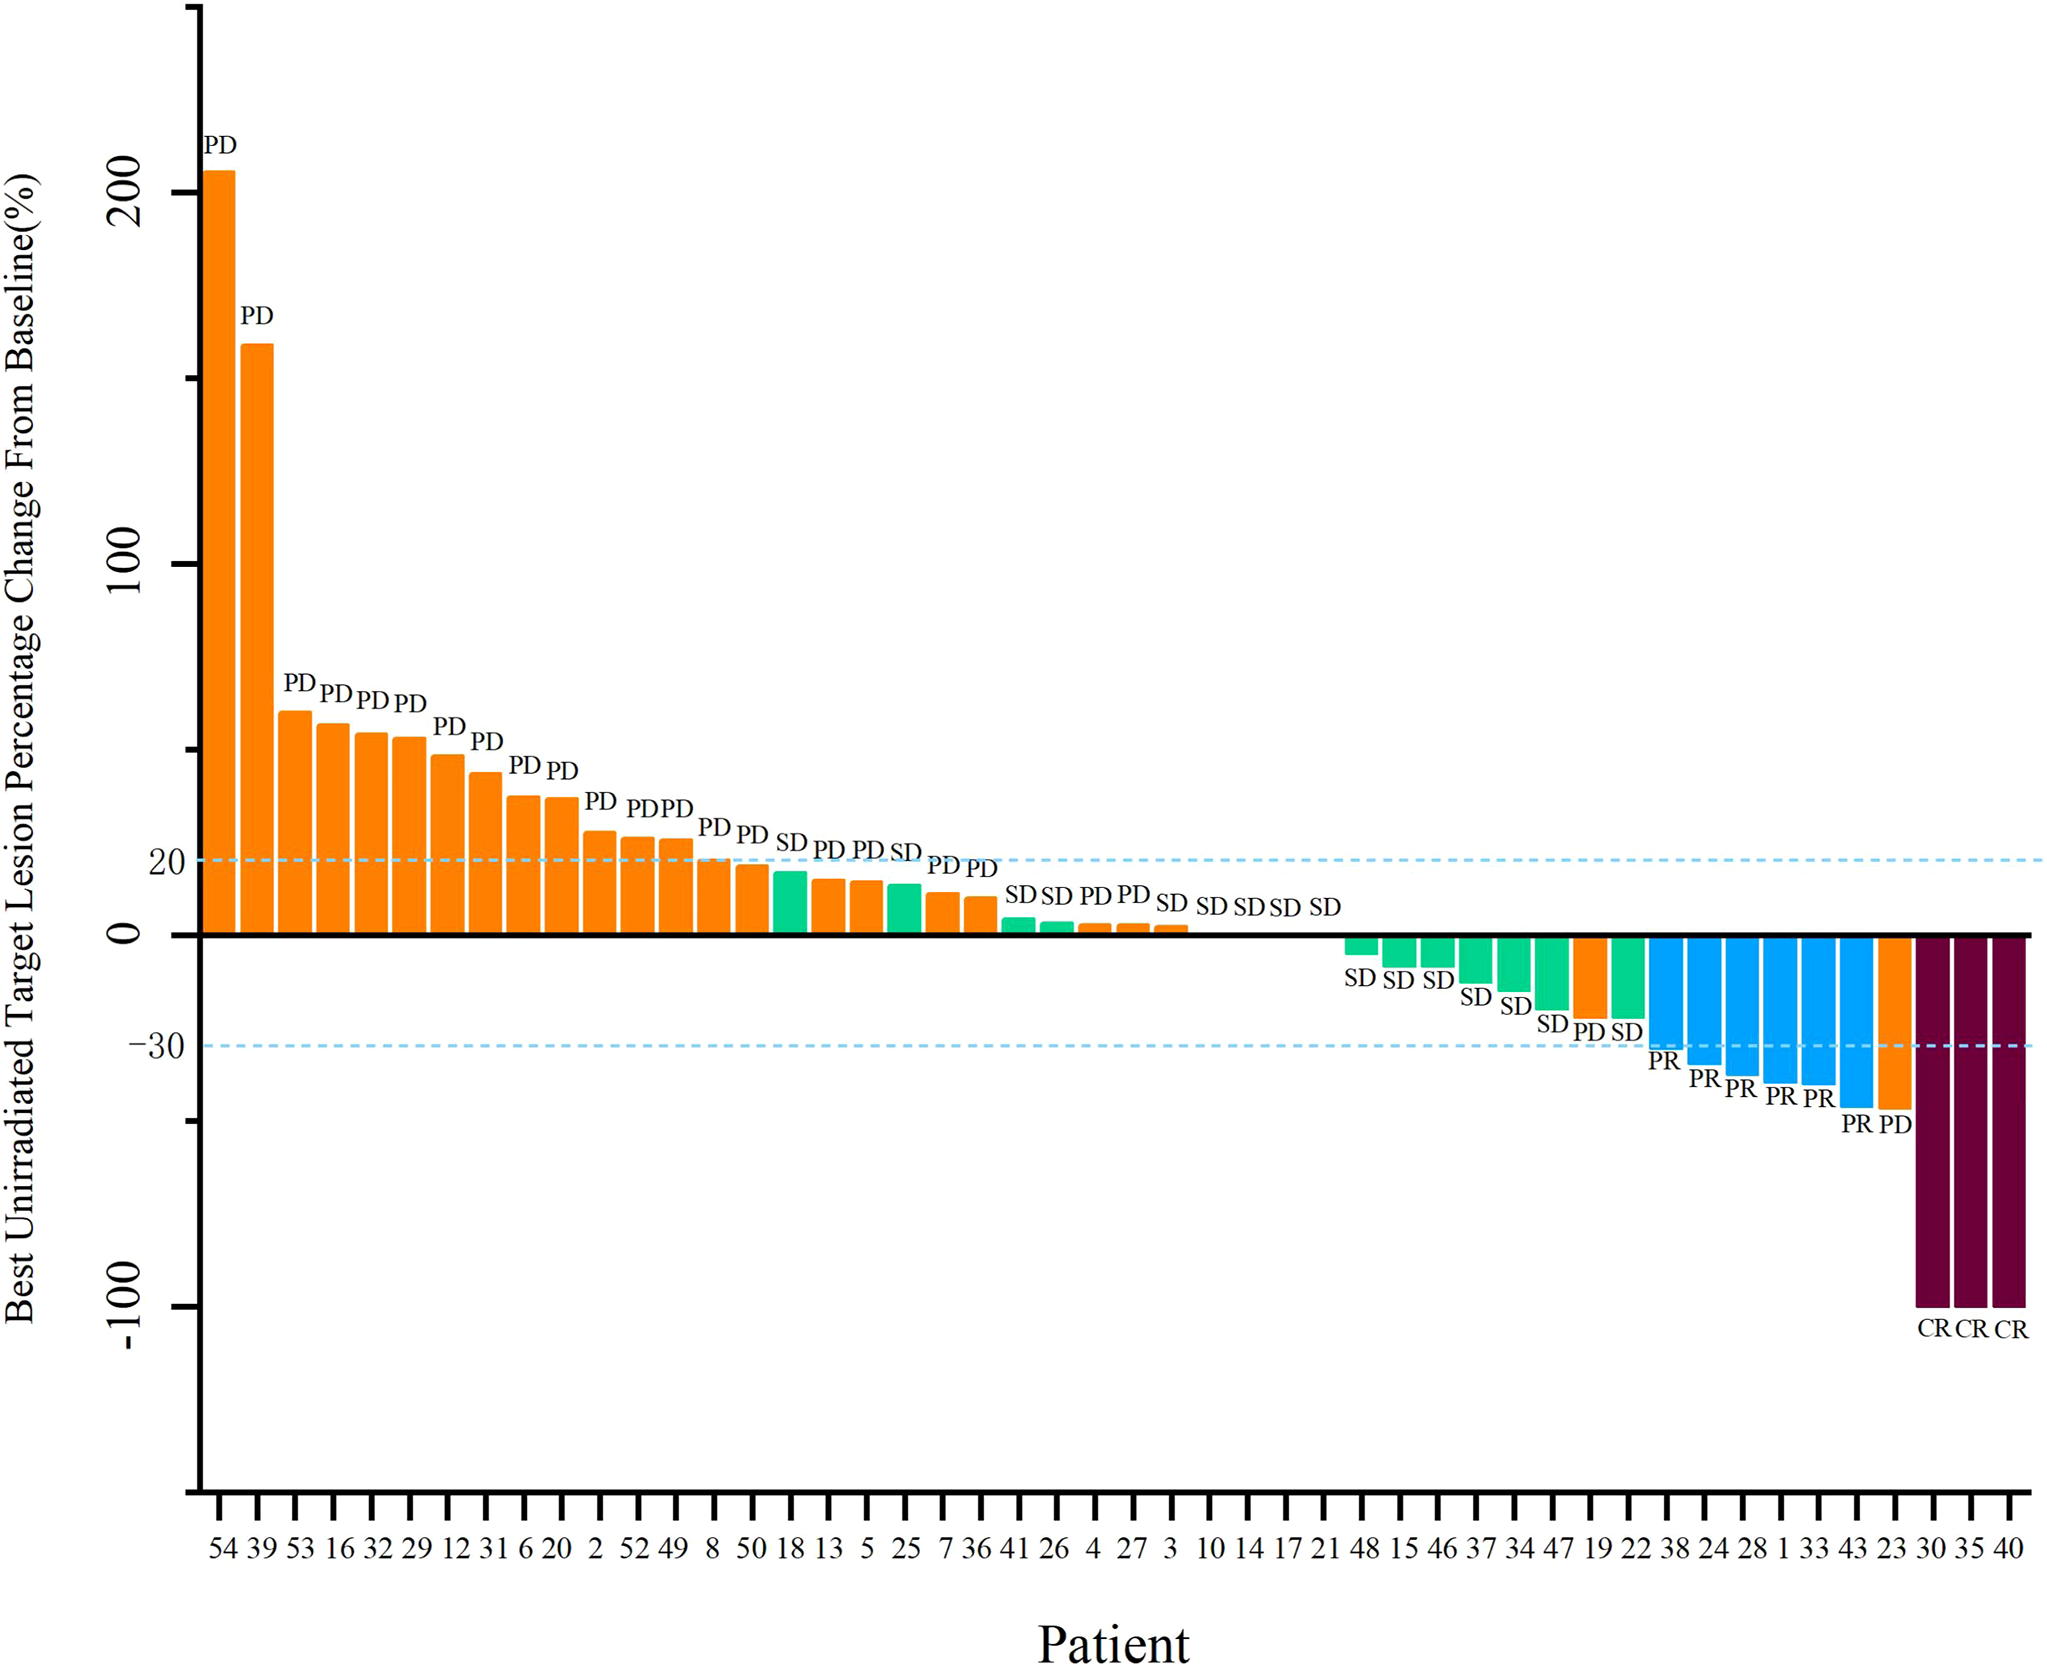
2022 · PHASE II STUDY
Each bar represents one response-evaluable patient. Bars below zero show shrinkage of nonirradiated target lesions; bars above zero show growth. Both responses and progression are visible. CR, PR, SD and PD denote the authors’ response categories; this uncontrolled study cannot establish superiority over another treatment.
© 2022 Kong et al. · Original figure 3 · CC BY 4.0
Read the figure and study →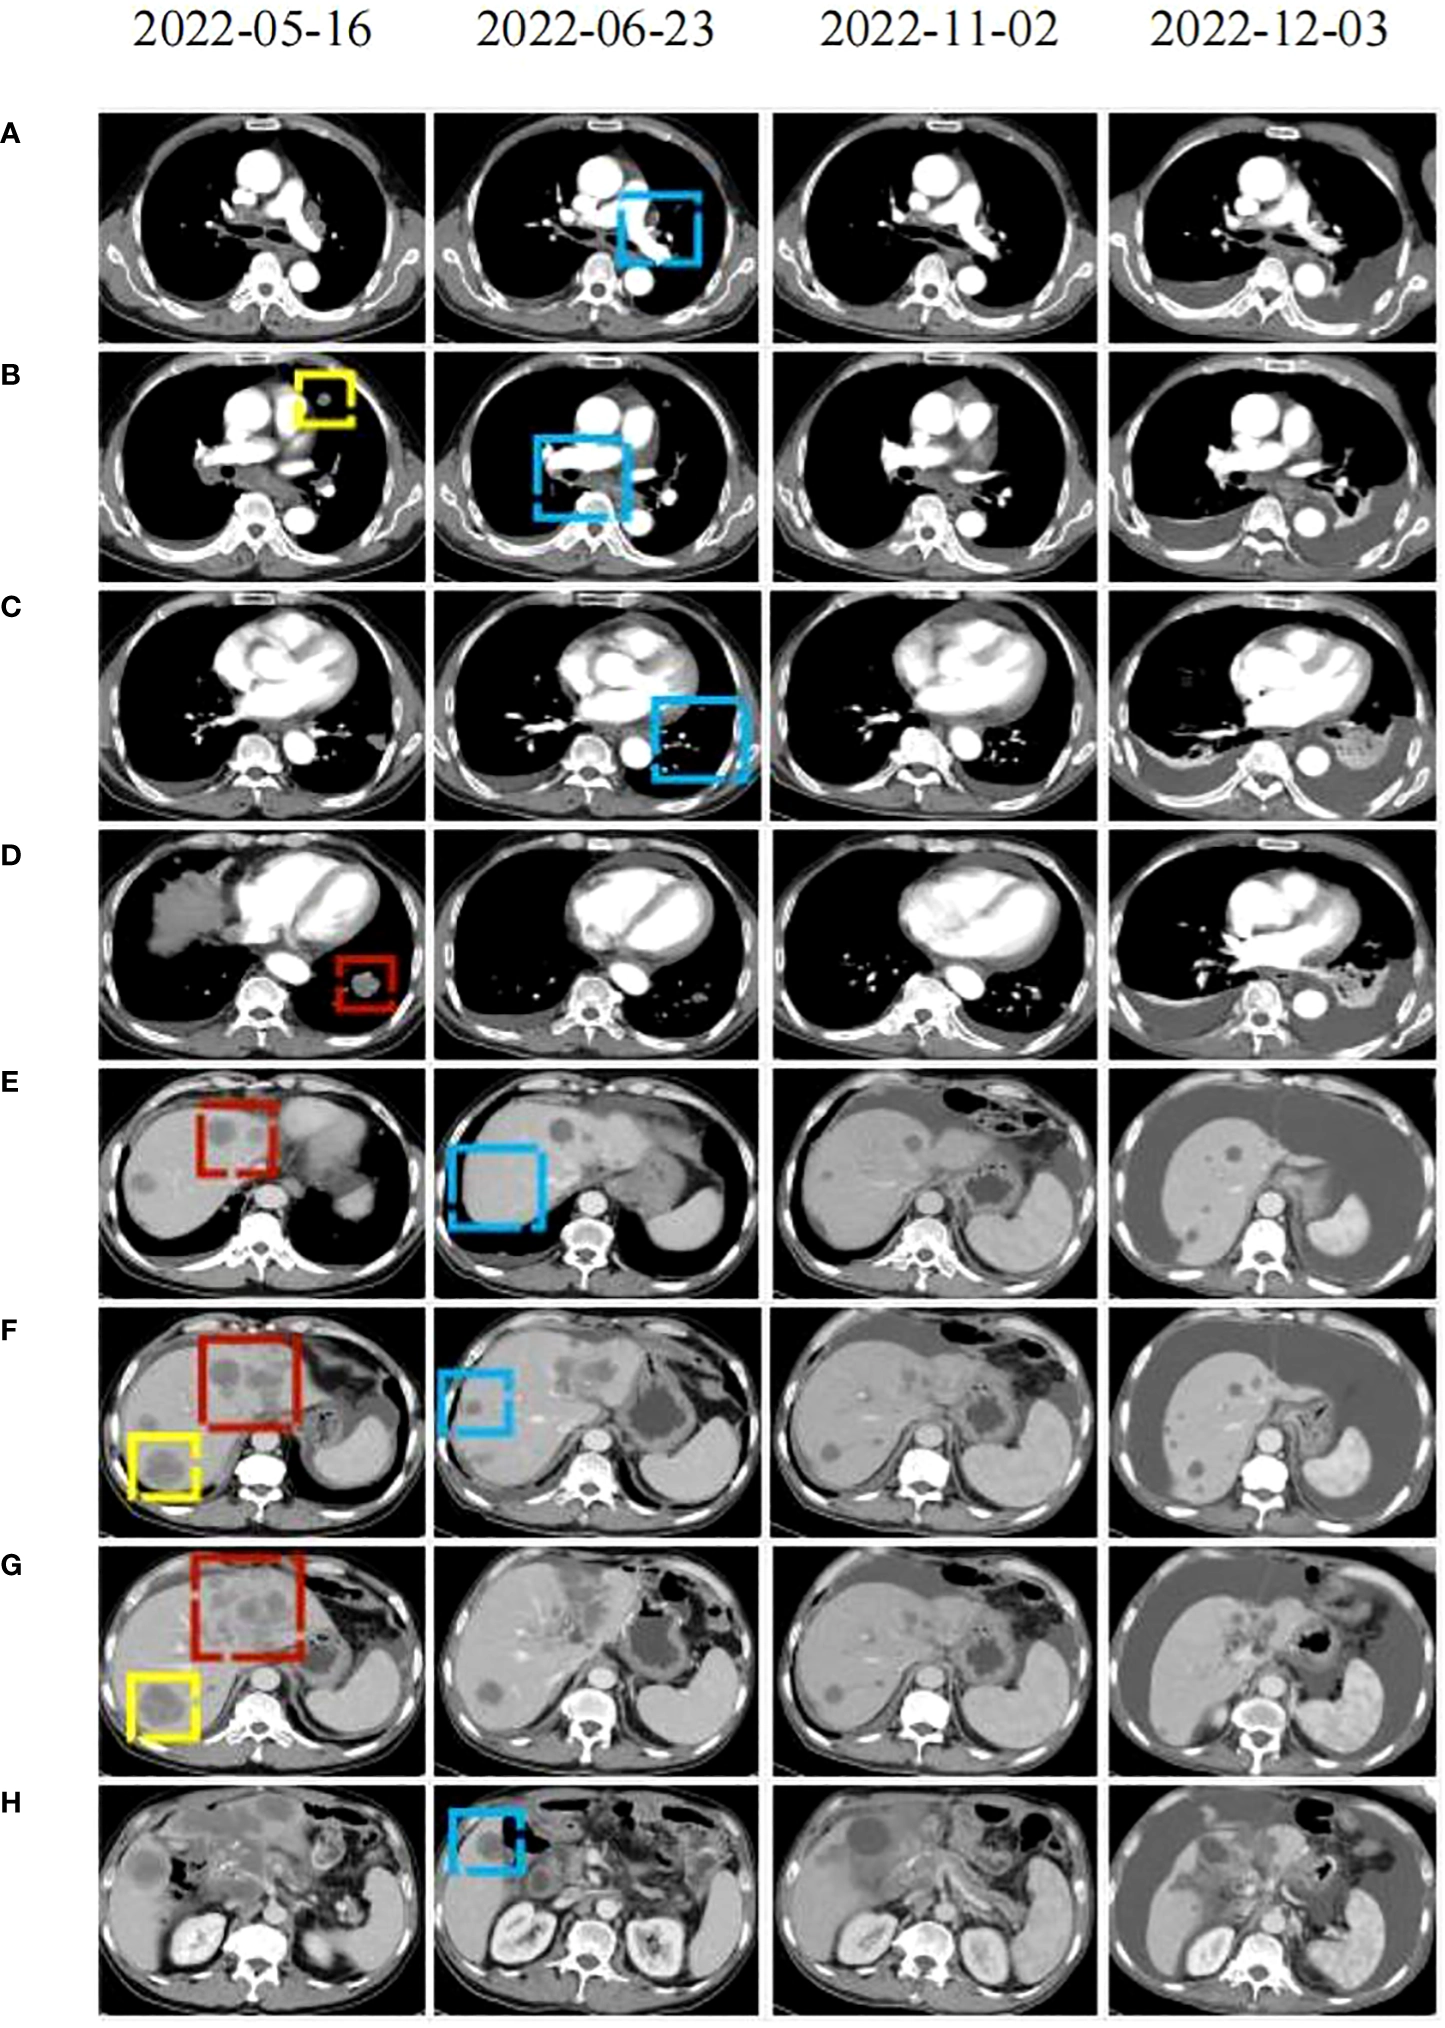
2024 · CASE REPORT
Read each row across the four scan dates. The authors show early regression, including at nonirradiated sites, followed by later progression. The complete sequence matters: one favorable scan is not the whole disease course. This is a single gastric-cancer case treated with a PRaG-derived combination including RC48.
© 2024 Liu, Wang, Zhang, Lu and Yang · Original figure 3 · CC BY 4.0
Read the figure and study →54 publication records · English and Chinese
PERSPECTIVE
Why promising case reports matter—and why they need careful interpretation.
PERSPECTIVE
How to navigate the growing family of PRaG research programs.
PERSPECTIVE
What a 54-patient study can tell us—and the questions it leaves open.
This independent resource brings together published research and trial records. Each report links to its sources and distinguishes results, protocols and individual cases.
Editorial policy →